I don’t know the technical term for this fallacy, but it’s unfortunately common for people to assert a causal link between a subpopulation A and trait B, look the incidence of B in A, and draw conclusions about the link without ever looking at B in the population that isn’t A. For instance, if you say a stock went down 5 points, that looks bad; if the whole market went down 10, that stock looks good; if companies similar to that stock went up 25, the stock looks bad. Context is key.
People who work with data habitually should be pretty good at avoiding this error; teams of people, including editors, should be very good at avoiding this issue. And yet we get stuff like this Wall Street Journal.
If it’s paywalled for you, it shows that the incidence of babies named Shea has bounced around over time in the tristate area (NY, NJ, CT), and the author Andrew Beaton attributes that to Mets fandom. The teaser in the tweet suggests as much: “When the Mets are good, more NYC-area babies are named Shea.” (To be fair, if you read that sentence strictly it only suggests correlation, but I think it’s reasonable to say that it’s a correlation that’s only interesting if there’s at least a vague causal link.)
The meat of this article is this chart:
Before returning to my main issue with the article, I want to point out three issues with this chart:
- Doesn’t adjust for population growth. The New York city MSA grew by about 16% from 1990 to 2010, so that’s worth taking into account.
- Doesn’t account for randomness. If you picked a fake time trend and generated data from it, would it look any different? Probably not, I suspect.
- Doesn’t have a consistent way of picking notable years. The highlighted years were pretty clearly chosen post-hoc, as there’s some inconsistency as to whether the spike comes the same year as the good performance (1986, sort of 2000) or after (2007, sort of 2000), and the division championship in 1988 is actually a trough. (Plus the 1969 World Series and 1973 pennant don’t seem to have an impact.)
You should look for all of those, in particular the second and third, when people make charts like that, but again, I’m here to talk about the one that came to me first, which is that they draw this conclusion about the tristate area without looking at any national data.
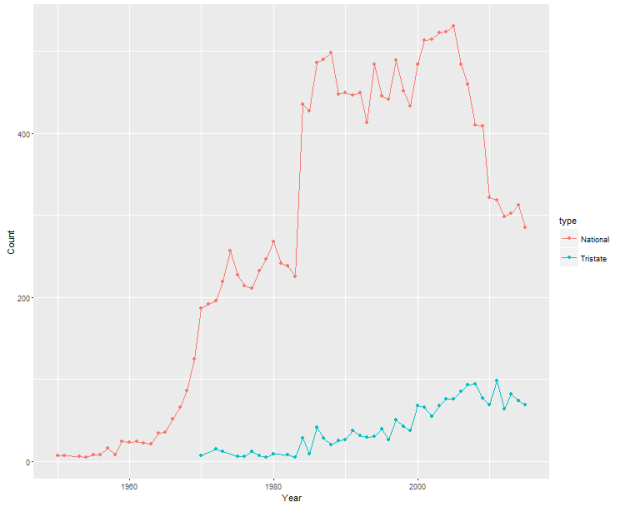
Here’s the plot of Shea over time, nationally:

This doesn’t directly disprove that there’s a Mets effect, since the trends aren’t the same, but the uptick in tristate Sheas in the mid-1980s is the same as that huge jump in the national trend, and the positive trend afterwards is also seen in both datasets. So, without pretty strong corroboration, it seems wrong to assert that this is a tristate trend, and not a national trend.
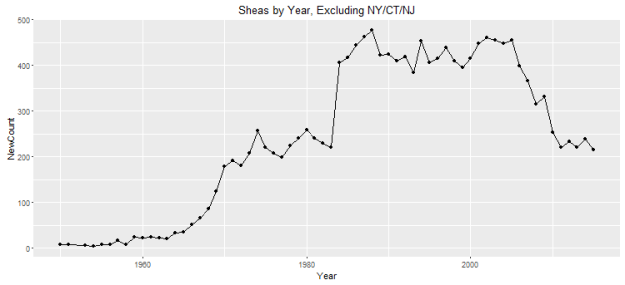
Does that mean it’s not Mets-related? Not necessarily, since there are Mets fans all over the country. But I would suspect that a healthy majority of them are located in those three states, and removing them doesn’t visually change the trend at all, so again, it’s pretty aggressive to attribute the relationship to the Mets.

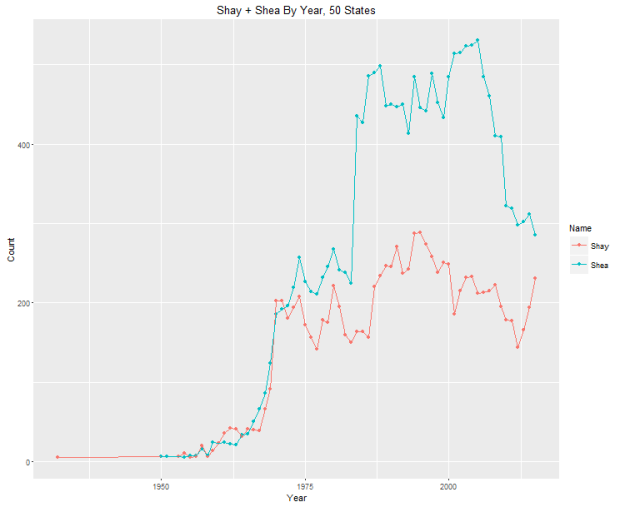
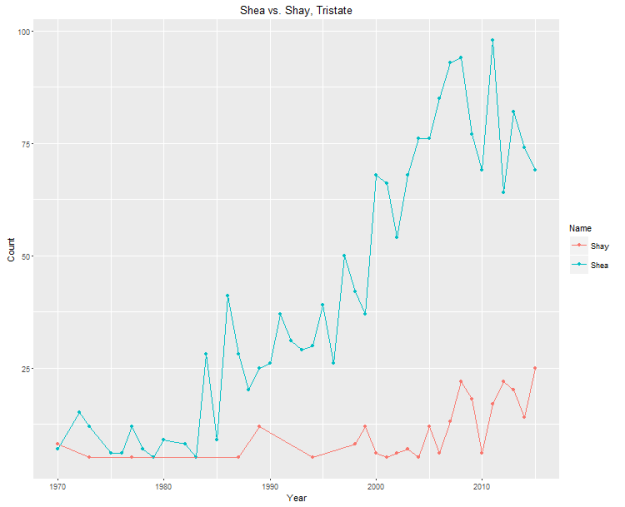
Finally, instead of using the other 47 states as a control, we can use a different one: the also somewhat common name “Shay.”


So, while the Shays ebb and flow in a way not too different from the Sheas for most of the past 30 years, there’s a persistent change in the Shea/Shay ratio right around the time the Mets got good for the first time that appears to be converging back after the close of Shea Stadium. Maybe that’s something, maybe it’s not; I didn’t adjust for gender and I don’t know what other demographic factors (e.g. ancestry) could affect this balance. My takeaway from the Shay analysis is that it provides minimal evidence for Mets fans driving Shea and some broad evidence for Shea Stadium driving the Shea/Shay ratio.
What I’m interested in isn’t really whether this piece’s conclusion about Shea is accurate; more broadly, my point is that this shows the real challenges associated with publishing good empirical work in the rhythm of a daily paper or blog. For a piece like this to be high enough quality to run, the researcher has to have both the ability and the resources to take an extra couple hours (at least) thinking about and testing alternate hypotheses and doing sensitivities, and after doing that will quite likely end up with a muddier conclusion (less interesting to most readers) or a null result like this (really uninteresting to most readers). The most likely good outcome is that you get a bunch of stuff that doesn’t change your conclusion that you either cram in a footnote (hurting your style but keeping geeks like me off your back) or omit altogether (easier, but very bad professional practice).
(It’s a separate issue, but they also didn’t release data and code for this, which is a big pet peeve of mine. It’s probably too much to ask people to add the underlying analysis for every tiny post (especially this one, which was probably just Excel) to a repository of some sort, but even a link to the raw data would be nice.)
I think there’s a place for people who can use SQL and R in the newsroom; I even do some stuff like this myself. (Just tonight I did some Retrosheet queries to answer a question on Twitter, and pieces like this one about John Danks are pretty similar in concept to the Shea piece.) I really do question, though, whether trying to keep pace with the more traditional side of the newsroom is good for readers, writers, or outlets; given the guaranteed drop in both quality and relevance of the analysis, it’s hard for me to believe it’s anything but bad.
I used Social Security Administration data, found here, for all of my analysis. I haven’t had a chance to clean my code up to get it on GitHub yet, but it’ll make it there soon I expect.

Stumbled across your blog a couple days ago, but I completely agree. It’s so easy these days to run, say, a regression and not think about the context or other spurious variables that might be causing a large correlation. I think some organizations do this better than others