I wrote this article a few months ago about goalie shootout performance and concluded two things:
- Goalies are not interchangeable with respect to the shootout, i.e. there is skill involved in goalie performance.
- An extra percentage point in shootout save percentage is worth about 0.002 standings points per game. This is based on some admittedly sketchy calculations based on long term NHL performance, and not something I think is necessarily super accurate.
I’m bringing this up because a couple of other articles have been written about this recently: one by Tom Tango and one much longer one by Michael Lopez. One of the comments over there, from Eric T., mentioned wanting a better sense of the practical significance of the differences in skill, given that Lopez offers an estimate that the difference between the best and worst goalies is worth about 3 standings points per year.
That’s something I was trying to do in the previous post up above, and the comment prompted me to try to redo it. I made some simple assumptions that align with the one’s Lopez did in his followup post:
- Each shot has equal probability of being saved (i.e. shooter quality doesn’t matter, only goalie quality). This probably reduces the volatility in my estimates, but since a goalie should end up facing a representative sample of shooters, I’m not too concerned.
- The goalie’s team has an equal probability of converting each shot. This, again, probably reduces the variance, but it makes modelling things much simpler, and I think it makes it easier to isolate the effect that goalie performance has on shootout winning percentage.
Given these assumptions, we can compute an exact probability that one team wins given team 1’s save percentage and team 2’s
. If you don’t care about the math, skip ahead to the table. Let’s call
the probability that team
scores
times in the first three rounds of the shootout:
The first term on the right side is just the sum of the probabilities of the ways that team 1 can win the first three rounds, e.g. 2 goals for and 1 allowed or 3 goals for and none allowed. The term on the right is the sum of all the ways they can win if the first three rounds end in a tie, which can be expressed easily as the sum of a geometric series.
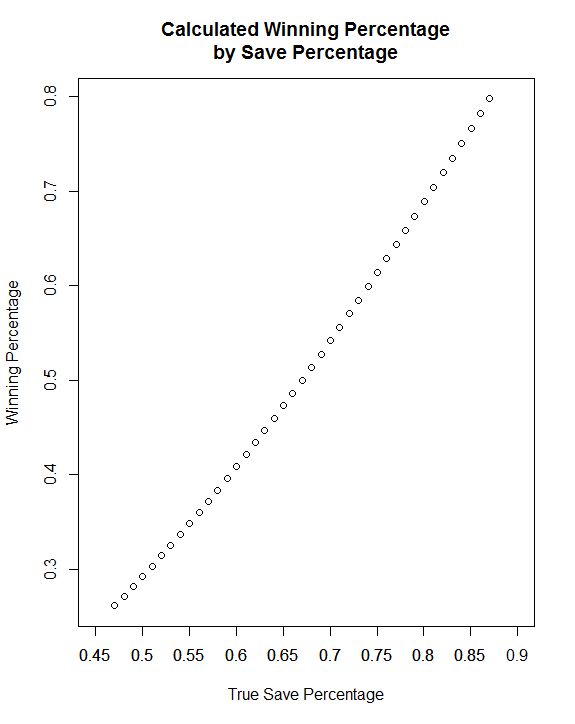
Ultimately, we don’t really care about the formula so much as the results, so here’s a table and a plot showing the performance of a goalies who are a given percentage below or above league average when facing a league average goalie:
| Percentage Points Above/Below League Average | Winning Percentage |
|---|---|
| -20 | 26.12 |
| -19 | 27.14 |
| -18 | 28.18 |
| -17 | 29.24 |
| -16 | 30.31 |
| -15 | 31.41 |
| -14 | 32.52 |
| -13 | 33.66 |
| -12 | 34.81 |
| -11 | 35.98 |
| -10 | 37.17 |
| -9 | 38.37 |
| -8 | 39.60 |
| -7 | 40.84 |
| -6 | 42.10 |
| -5 | 43.37 |
| -4 | 44.67 |
| -3 | 45.98 |
| -2 | 47.30 |
| -1 | 48.64 |
| 0 | 50.00 |
| 1 | 51.37 |
| 2 | 52.76 |
| 3 | 54.16 |
| 4 | 55.58 |
| 5 | 57.01 |
| 6 | 58.45 |
| 7 | 59.91 |
| 8 | 61.38 |
| 9 | 62.86 |
| 10 | 64.35 |
| 11 | 65.85 |
| 12 | 67.37 |
| 13 | 68.89 |
| 14 | 70.42 |
| 15 | 71.96 |
| 16 | 73.51 |
| 17 | 75.06 |
| 18 | 76.62 |
| 19 | 78.19 |
| 20 | 79.76 |
We would expect most of these figures to be close to league average, so if we borrow Tom Tango’s results (see the link above) we figure the most and least talented goalies are going to be roughly 6 percentage points away from the mean. The difference between +0.06 and -0.06 is about 0.16 in the simulation output, meaning the best goalies are likely to win sixteen shootouts per hundred more than the worst goalies assuming both play average competition.
Multiplying this by 13.2%, the past frequency of shootouts, and we get an estimated benefit of only about 0.02 standings points / game from switching from the worst shootout goalie to the best. For a goalie making 50 starts, that’s only about 1 point added to the team, and that’s assuming maximal possible impact.
Similarly, moving up this curve by one percentage point appears to be worth about 1.35 wins per hundred; multiplying that by 13.2% gives a value of 0.0018 standings points / game, which is almost exactly what I got when I did this empirically in the prior post, which leads me to believe that that estimate is a lot stronger than I initially thought.
There’s obviously a lot of assumptions in play here, including the assumptions going into my probabilities and Tango’s estimates of true performance, and I’m open to the idea that one or another of those is suppressing the importance of this skill. Overall, though, I’m largely inclined to hew to my prior conclusions saying that for a difference in shootout performance to be enough to make one goalie better overall than another, it has to be a fairly substantial one, and the difference in actual save percentage has to be correspondingly fairly small.
