I wrote an article for The Hardball Times about using subterfuge to obtain the platoon advantage. Check it out here.
Playing the A’s? Grow a Beard?
Leave a reply
I wrote an article for The Hardball Times about using subterfuge to obtain the platoon advantage. Check it out here.
Quick summary: I test the ZiPS and Marcel projection systems to see if their errors are larger for players with larger platoon splits. A first check says that they are not, though a more nuanced examination of the system remains to be conducted.
First, a couple housekeeping notes:
After the A’s went on their trading sprees last week at the trading deadline, there was much discussion about how they were going to intelligently deploy the rest of their roster to cover for the departure of Yoenis Cespedes. This is part of a larger pattern with the A’s as they continue to be very successful with their platoons and wringing lots of value out of their depth. Obviously, when people have tried to determine the impact of this trade, they’ve been relying on projections for each of the individual players involved.
What prompted my specific question is that Jonny Gomes is one of those helping to fill Cespedes’s shoes, and Gomes has very large platoon splits. (His career OPS is .874 against left-handed pitchers and .723 against righties.) The question is what proportion of Gomes’s plate appearances the projection systems assume will be against right handers; one might expect that if he is deployed more often against lefties than the system projects, he might beat the projections substantially.
Since Jonny Gomes in the second half of 2014 constitutes an extremely small sample, I decided to look at a bigger pool of players from the last few years and see if platoon splits correlated at all with a player beating (or missing) preseason projections. Specifically, I used the 2010, 2012, and 2013 ZiPS and Marcel projections (via the Baseball Projection Project, which doesn’t have 2011 ZiPS numbers).
A bit of background: ZiPS is the projection system developed by Dan Szymborski, and it’s one of the more widely used ones, if only because it’s available at FanGraphs and relatively easy to find there. Marcel is a very simple projection system developed by Tangotiger (it’s named after the monkey from Friends) that is sometimes used as a baseline for other projection systems. (More information on the two systems is available here.)
So, once I had the projections, I needed to come up with a measure of platoon tendencies. Since the available ZiPS projections only included one rate stat, batting average, I decided to use that as my measure of batting success. I computed platoon severity by taking the larger of a player’s BA against left-handers and BA against right-handers and dividing by the smaller of those two numbers. (As an example, Gomes’s BA against RHP is .222 and against LHP is .279, so his ratio is .279/.222 = 1.26.) My source for those data is FanGraphs.
I computed that severity for players with at least 500 PA against both left-handers and right-handers going into the season for which they were projected; for instance, for 2010 I would have used career data stopping at 2009. I then looked at their actual BA in the projected year, computed the deviation between that BA and the projected BA, and saw if there was any correlation between the deviation and the platoon ratio. (I actually used the absolute value of the deviation, so that magnitude was taken into account without worrying about direction.) Taking into account the availability of projections and requiring that players have at least 150 PA in the season where the deviation is measured, we have a sample size of 556 player seasons.
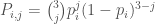
As it turns out, there isn’t any correlation between the two parameters. My hypothesis was that there’d be a positive correlation, but the correlation is -0.026 for Marcel projections and -0.047 for ZiPS projections, neither of which is practically or statistically significantly different from 0. The scatter plots for the two projection systems are below:
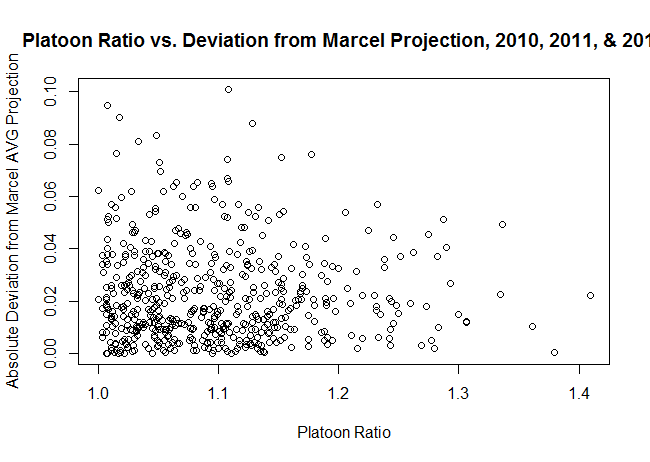
Now, there are a number of shortcomings to the approach I’ve taken:
So, if you’re looking for a takeaway, it’s that large platoon-split players on the whole do not appear to be poorly projected (for BA by ZiPS and Marcel), but it’s still possible that those with a large change in circumstances might differ from their projections.
I wrote this article a few months ago about goalie shootout performance and concluded two things:
I’m bringing this up because a couple of other articles have been written about this recently: one by Tom Tango and one much longer one by Michael Lopez. One of the comments over there, from Eric T., mentioned wanting a better sense of the practical significance of the differences in skill, given that Lopez offers an estimate that the difference between the best and worst goalies is worth about 3 standings points per year.
That’s something I was trying to do in the previous post up above, and the comment prompted me to try to redo it. I made some simple assumptions that align with the one’s Lopez did in his followup post:
Given these assumptions, we can compute an exact probability that one team wins given team 1’s save percentage 


The first term on the right side is just the sum of the probabilities of the ways that team 1 can win the first three rounds, e.g. 2 goals for and 1 allowed or 3 goals for and none allowed. The term on the right is the sum of all the ways they can win if the first three rounds end in a tie, which can be expressed easily as the sum of a geometric series.
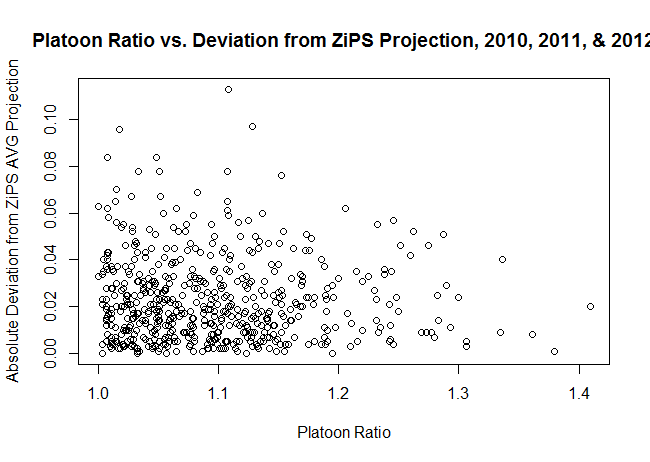
Ultimately, we don’t really care about the formula so much as the results, so here’s a table and a plot showing the performance of a goalies who are a given percentage below or above league average when facing a league average goalie:
| Percentage Points Above/Below League Average | Winning Percentage |
|---|---|
| -20 | 26.12 |
| -19 | 27.14 |
| -18 | 28.18 |
| -17 | 29.24 |
| -16 | 30.31 |
| -15 | 31.41 |
| -14 | 32.52 |
| -13 | 33.66 |
| -12 | 34.81 |
| -11 | 35.98 |
| -10 | 37.17 |
| -9 | 38.37 |
| -8 | 39.60 |
| -7 | 40.84 |
| -6 | 42.10 |
| -5 | 43.37 |
| -4 | 44.67 |
| -3 | 45.98 |
| -2 | 47.30 |
| -1 | 48.64 |
| 0 | 50.00 |
| 1 | 51.37 |
| 2 | 52.76 |
| 3 | 54.16 |
| 4 | 55.58 |
| 5 | 57.01 |
| 6 | 58.45 |
| 7 | 59.91 |
| 8 | 61.38 |
| 9 | 62.86 |
| 10 | 64.35 |
| 11 | 65.85 |
| 12 | 67.37 |
| 13 | 68.89 |
| 14 | 70.42 |
| 15 | 71.96 |
| 16 | 73.51 |
| 17 | 75.06 |
| 18 | 76.62 |
| 19 | 78.19 |
| 20 | 79.76 |
We would expect most of these figures to be close to league average, so if we borrow Tom Tango’s results (see the link above) we figure the most and least talented goalies are going to be roughly 6 percentage points away from the mean. The difference between +0.06 and -0.06 is about 0.16 in the simulation output, meaning the best goalies are likely to win sixteen shootouts per hundred more than the worst goalies assuming both play average competition.
Multiplying this by 13.2%, the past frequency of shootouts, and we get an estimated benefit of only about 0.02 standings points / game from switching from the worst shootout goalie to the best. For a goalie making 50 starts, that’s only about 1 point added to the team, and that’s assuming maximal possible impact.
Similarly, moving up this curve by one percentage point appears to be worth about 1.35 wins per hundred; multiplying that by 13.2% gives a value of 0.0018 standings points / game, which is almost exactly what I got when I did this empirically in the prior post, which leads me to believe that that estimate is a lot stronger than I initially thought.
There’s obviously a lot of assumptions in play here, including the assumptions going into my probabilities and Tango’s estimates of true performance, and I’m open to the idea that one or another of those is suppressing the importance of this skill. Overall, though, I’m largely inclined to hew to my prior conclusions saying that for a difference in shootout performance to be enough to make one goalie better overall than another, it has to be a fairly substantial one, and the difference in actual save percentage has to be correspondingly fairly small.
One of the bizarre things about hockey is that the current standings system gives teams extra points for winning shootouts, which is something almost entirely orthogonal to, you know, actually being a good hockey team. I can’t think of another comparable situation in sports. Penalty shootouts in soccer are sort of similar, but they only apply in knockout situations, whereas shootouts in hockey only occur in the regular season.
Is this stupid? Yes, and a quick Google will bring up a fair amount of others’ justified ire about shootouts and their effect on standings. I think the best solution is something along the lines of a 10 minute overtime (loser gets no points), and if it’s tied after 70 then it stays a tie. Since North Americans hate ties, though, I can’t imagine that change being made, though.
What makes it so interesting to me, though, is that it opens up a new set of metrics for evaluating both skaters and goalies. Skaters, even fourth liners, can contribute a very large amount through succeeding in the shootout, given that it’s approximately six events and someone gets an extra point out of it. Measuring shooting and save percentage in shootouts is pretty easy, and there’s very little or no adjustment needed to see how good a particular player is.
The first question we’d like to address is: is it even reasonable to say that certain players are consistently better or worse in shootouts, or is this something that’s fundamentally random (as overall shooting percentage is generally thought to be in hockey)? We’ll start this from the goalie side of things; in a later post, I’ll move onto the skaters.
Since the shootout was introduced after the 2004-05 lockout, goalies have saved 67.1% of all shot attempts. (Some data notes: I thought about including penalty shots as well, but those are likely to have a much lower success rate and don’t occur all that frequently, so I’ve omitted them. All data come from NHL or ESPN and are current as of the end of the 2012-13 season. UPDATE: I thought I remembered confirming that penalty shots have a lower success rate, but some investigations reveal that they are pretty comparable to shootout attempts, which is a little interesting. Just goes to show what happens when you assume things.)
Assessing randomness here is pretty tricky; the goalie in my data who has seen the most shootout attempts is Henrik Lundqvist, with 287. That might seem like a lot, but he’s seen a little over 14,000 shots in open play, which is a bit less than 50 times as many. This means that things are likely to be intensely volatile, at least from season to season. This intuition is correct, as looking at the year-over-year correlation between shootout save percentages (with each year required to have at least 20 attempts against) gets us a correlation of practically 0 (-0.02, with a wide confidence interval).
Given that there are only 73 pairs of seasons in that sample, and the threshold is only 20 attempts, we are talking about a very low power test, though. However, there’s a different, and arguably better, way to do this: look at how many extreme values we see in the distribution. This is tricky when modelling certain things, as you have to have a strong sense of what the theoretical distribution really is. Thankfully, given that there are only two outcomes here, if there is really no goaltender effect, we would expect to see a nice neat binomial distribution (analogous to a weighted coin). (There’s one source of heterogeneity I know I’m omitting, and that’s shooter quality. I can’t be certain that doesn’t contaminate these data, but I see no reason it would introduce bias rather than just error.)
We can test this by noting that if all goalies are equally good at shootouts, they should all have a true save percentage of 67% (the league rate). We can then calculate the probability that a given goalie would have the number of saves they do if they performed league average, and if we get lots of extreme values we can sense that there is something non-random lurking.
There have been 60 goalies with at least 50 shootout attempts against, and 14 of them have had results that would fall in the most extreme 5% relative to the mean if they in fact performed at a league average rate. (This is true even if we attempt to account for survivorship bias by only looking at the average rate for goalies that have that many attempts.) The probability that at least that many extreme values occur in a sample of this size is on the order of 1 in 5 million. (The conclusion doesn’t change if you look at other cutoffs for extreme values.) To me, this indicates that the lack of year over year correlation is largely a function of the lack of power and there is indeed something going on here.
The tables below shows some figures for the best and worst shootout goalies. Goalies are marked as significant if the probability they would get that percentage if they were actually league average is less than 5%.
| Player | Attempts | Saves | Percentage | Significant | |
|---|---|---|---|---|---|
| 1 | Semyon Varlamov, G | 71 | 55 | 77.46 | Yes |
| 2 | Brent Johnson, G | 55 | 42 | 76.36 | Yes |
| 3 | Henrik Lundqvist, G | 287 | 219 | 76.31 | Yes |
| 4 | Marc-Andre Fleury, G | 177 | 135 | 76.27 | Yes |
| 5 | Antti Niemi, G | 133 | 101 | 75.94 | Yes |
| 6 | Mathieu Garon, G | 109 | 82 | 75.23 | Yes |
| 7 | Johan Hedberg, G | 129 | 97 | 75.19 | Yes |
| 8 | Manny Fernandez, G | 63 | 46 | 73.02 | No |
| 9 | Rick DiPietro, G | 126 | 92 | 73.02 | No |
| 10 | Josh Harding, G | 55 | 40 | 72.73 | No |
| Player | Attempts | Saves | Percentage | Significant | |
|---|---|---|---|---|---|
| 1 | Vesa Toskala, G | 63 | 33 | 52.38 | Yes |
| 2 | Ty Conklin, G | 55 | 29 | 52.73 | Yes |
| 3 | Martin Biron, G | 76 | 41 | 53.95 | Yes |
| 4 | Jason LaBarbera, G | 77 | 43 | 55.84 | Yes |
| 5 | Curtis Sanford, G | 50 | 28 | 56.00 | No |
| 6 | Niklas Backstrom, G | 176 | 99 | 56.25 | Yes |
| 7 | Jean-Sebastien Giguere, G | 155 | 93 | 60.00 | Yes |
| 8 | Miikka Kiprusoff, G | 185 | 112 | 60.54 | Yes |
| 9 | Sergei Bobrovsky, G | 51 | 31 | 60.78 | No |
| 10 | Chris Osgood, G | 67 | 41 | 61.19 | No |
So, some goalies are actually good (or bad) at shootouts. This might seem obvious, but it’s a good thing to clear up. Another question: are these the same goalies that are better at all times? Not really, as it turns out; the correlation between raw save percentage (my source didn’t have even strength save percentage, unfortunately) and shootout save percentage is about 0.27, which is statistically significant but only somewhat practically significant—using the R squared from regressing one on the other, we figure that goalie save percentage only predicts about 5% of the variation in shootout save percentage.
You may be asking: what does all of this mean? Well, it means it might not be fruitless to attempt to incorporate shooutout prowess into our estimates of goalie worth. After all, loser points are a thing, and it’s good to get more of them. To do this, we should estimate what the relationship between a shootout goal and winning the shootout (i.e., collecting the extra point) is. To do this, I followed the basic technique laid in this Tom Tango post. Since shootouts per season are so small, I used lifetime data for each of the 30 franchises to come up with an estimate for the number of points that one shootout goal is worth. Regressing goal difference per game on winning percentage, we get a coefficient of 0.368. In other words, one shootout goal is worth about 0.368 shootout wins (that is, points).
Two quick asides about this: one is that there’s an endemic flaw in this estimator even beyond sample size issues, and that’s that the skipping of an attempt when a team is up 2-0 (or 3-1) means that we are deprived of some potentially informative events simply due to the construction of the shootout. Another is that while this is not a perfect estimate, it does a pretty good job predicting things (R squared of 0.9362, representing the fraction of the variance explained by the goal difference).
Now that we can convert shootout goals to wins, we can weigh the relative meaning of a goaltender’s performance in shootouts and in actual play. This research says that each goal is worth about 0.1457 wins, or 0.291 points, meaning that a shootout goal is worth about 26% more than a goal in open play. However, shootouts occur infrequently, so obviously a change of 1% in shootout save percentage is worth much less than a change of 1% in overall save percentage. How much less?
To get this figure, we’re going to assume that we have two goalies facing basically identical, average conditions. The first parameter we need is the frequency of shootouts occurring, which since their establishment has been about 13.2% of games. The next is the number of shots per shootout, which is about 3.5 per team (and thus per goalie). Multiplying this out gets a figure of 0.46 shootout shots per game, a save on which is worth 0.368 points, meaning that a 1% increase in shootout save percentage is worth about 0.0017 points per game.
To compute the comparable figure for regular save percentage, I’ll use the league average figure for shots in a game last year, which is about 29.75. Each save is worth about 0.29 points, so a 1% change in regular save percentage is worth about 0.087 points per game. This is, unsurprisingly, much much more than the shootout figure; it suggests that a goalie would have to be 51 percentage points better in shootouts to make up for 1 percentage point of difference in open play. (For purposes of this calculation, let’s assume that overall save percentage is equal to a goalie’s even strength save percentage plus an error term that is entirely due to his team, just to make all of our comparisons apples to apples. We’re also assuming that the marginal impact of a one percentage point change on a team’s likelihood of winning is constant, which isn’t too true.)
Is it plausible that this could ever come into play? Yes, somewhat surprisingly. The biggest observed gap between two goalies in terms of shootout performance is in the 20-25% range (depends on whether you want to include goalies with 50+ attempts or only 100+). A 20% gap equates to a 0.39% change in overall save percentage, and that’s not a meaningless gap given how tightly clustered goalie performances can be. If you place the goalie on a team that allows fewer shots, it’s easier to make up the gap—a 15% gap in shootout performance is equivalent to a 0.32% change in save percentage for a team that gives up 27 shots a game. (Similarly, a team with a higher probability of ending up in a shootout has more use for the shootout goalie.)
Is this particularly actionable? That’s less clear, given how small these effects are and how much uncertainty there is in both outcomes (will this goalie actually face a shootout every 7 times out?) and measurement (what are the real underlying save percentages?). (With respect to the measurement question, I’d be curious to know how frequently NHL teams do shootout drills, how much they record about the results, and if those track at all with in-game performance.) Still, it seems reasonable to say that this is something that should be at least on the table when evaluating goalies, especially for teams looking for a backup to a durable and reliable #1 (the case that means that a backup will be least likely to have to carry a team in the playoffs, when being good at a shootout is pretty meaningless).
Moreover, you could maximize the effect of a backup goalie that was exceptionally strong at shootouts by inserting him in for a shootout regardless of whether or not he was the starter. That would require a coach to have a) enough temerity to get second-guessed by the press, b) a good enough rapport with the starter that it wouldn’t be a vote of no confidence, and c) confidence that the backup could perform up to par without any real warmup. This older article discusses the tactic and the fact that it hasn’t worked in a small number of cases, but I suspect you’d have to try this for a while to really gauge whether or not it’s worthwhile. For whatever it’s worth, the goalie pulled in the article, Vesa Toskala, has the worst shootout save percentage of any goalie with at least 50 attempts against (52.4%).
I still think the shootout should be abolished, but as long as it’s around it’s clear to me that on the goalie end of things this is something to consider when evaluating players. (As it seems that it is when evaluating skaters, which I’ll take a look at eventually.) However, without a lot more study it’s not clear to me that it rises to the level of the much-beloved “market inefficiency.”
EDIT: I found a old post that concludes that shootouts are, in fact, random, though it’s three years old and using slightly different methods than I am. The three years old portion is pretty important, because that means that the pool of data has increased by a substantial margin since then. Food for thought, however.
During the Tigers-Red Sox game last night, Tim McCarver said he thought it was a little odd that the Tigers would bring in lefty Drew Smyly to face David Ortiz while also leaving the shift on, since lefties are more likely to go to the opposite field against a left-handed pitcher. (At the very least, I know he said this last part. Memory is a tricky thing, and I’m now not sure whether he said this about Ortiz or someone else, possibly Alex Avila.) Being Tim McCarver, he didn’t say why this might be true, nor did he cite a source for this information, putting this firmly in the realm of obnoxious hypotheses.
The first question is whether or not this is true. For that, there are these handy aggregated spray charts, courtesy Brooks Baseball.
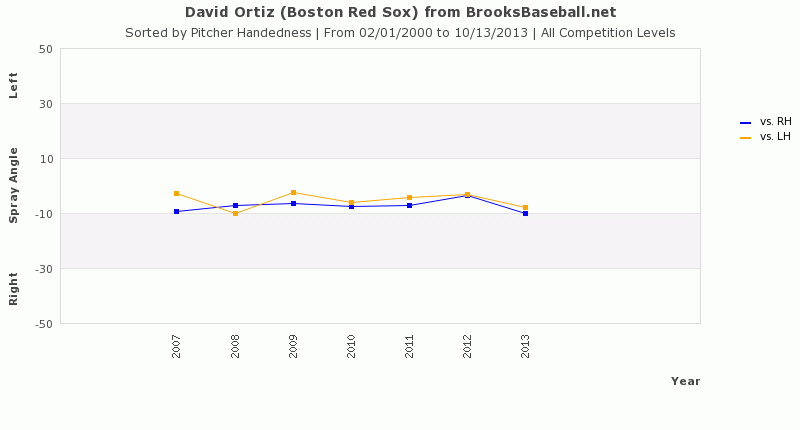

Based on these data, I have to say it seems like McCarver’s assertion is true: they are slightly more likely to go to left against a left-handed pitcher. I don’t have enough information to say if the differences are either statistically significant (I’d guess it is, given the number of balls these guys have put into play in the last 5-7 years) or practically significant (I kinda doubt it). Regardless of the answer, though, the fact remains that the appropriate thing to do is to bring in the lefty and shift slightly less drastically, so who knows why McCarver brought this up to begin with. After all, Ortiz hits drastically worse against lefties (his OPS against lefties is 24% smaller than his lifetime rate, via baseball-reference), as does Avila (36%).
There’s also the question of why this might be true, and in fairness to McCarver, there are some pretty plausible mechanisms for what he was saying. One is that a breaking pitch from a left-hander is more likely to be on the outer part of the plate for a left-handed batter than a similar pitch from a right-handed batter, and outside pitches are more likely to get hit the other way. Another is that left-handed batters can’t pick up a pitch as easily against a left-handed pitcher, so they are more likely to make late contact, which is in turn more likely to go to the opposite field. I can’t necessarily confirm either of these mechanisms empirically, though looking at Brooks splits for Avila and Ortiz suggests that the fraction of outside pitches they see against left-handers is about 3 percentage points larger than the fraction against righties.
So, what McCarver said was true (though not terribly helpful), and there are seemingly good reasons for it to be true. I still posted something, though, because this is a great example of something that pisses me off about sports commentators–a tendency to toss out suppositions and not bother with supporting or explaining them. (Another good example of this is Hawk Harrelson.) That tendency, along with their love of throwing out hypotheses that are totally unfalsifiable (McCarver asserting that the pitching coach coming out to the mound is valuable, e.g.), is one of the things I plan to deal with pretty regularly in this space.
(Happy first post, everyone.)