Like most White Sox fans, I was disappointed when Mark Buehrle left the team. I didn’t necessarily think they made a bad decision, but Buehrle is one of those guys that makes me really appreciate baseball on a sentimental level. He’s never seemed like a real ace, but he’s more interesting: he worked at a quicker pace than any other pitcher, was among the very best fielding pitchers, and held runners on like few others (it’s a bit out of date, but this post has him picking off two batters for each one that steals, which is astonishing).
In my experience, these traits are usually discussed as though they’re unrelated to his value as a pitcher, and the same could probably be said of the fielding skills possessed by guys like Jim Kaat and Greg Maddux. However, that’s covering up a non-negligible portion of what Buehrle has brought to his teams over the year; using a crude calculation of 10 runs per win, his 87 Defensive Runs Saved are equal to about 20% of his 41 WAR during the era for which have DRS numbers. (Roughly half of that 20% is from fielding his position, with the other half coming from his excellent work in inhibiting base thieves. Defensive Runs Saved are a commonly used, all-encompassing defensive metric from Baseball Info Solutions. All numbers in this piece are from Fangraphs. ) Buehrle’s extreme, but he’s not the only pitcher like this; Jake Westbrook had 62 DRS and only 18 WAR or so in the DRS era, which means the DRS equate to more than 30% of the WAR.
So fielding can make up a substantial portion of a pitcher’s value, but it seems like we rarely discuss it. That makes a fair amount of sense; single season fielding metrics are considered to be highly variable for position players who will be on the field for six times as many innings as a typical starting pitcher, and pitcher defensive metrics are less trustworthy even beyond that limitation. Still, though, I figured it’d be interesting to look at which sorts of pitchers tend to be better defensively.
For purposes of this study, I only looked at what I’ll think of as “fielding runs saved,” which is total Defensive Runs Saved less runs saved from stolen bases (rSB). (If you’re curious, there is a modest but noticeable 0.31 correlation between saving runs on stolen bases and fielding runs saved.) I also converted it into a rate stat by dividing by the number of innings pitched and then multiplying by 150 to give a full season rate. Finally, I restricted to aggregate data from the 331 pitchers who threw at least 300 innings (2 full seasons by standard reckoning) between 2007 and 2013; 2007 was chosen because it’s the beginning of the PitchF/X era, which I’ll get to in a little bit. My thought is that a sample size of 330 is pretty reasonable, and while players will have changed over the full time frame it also provides enough innings that the estimates will be a bit more stable.
One aside is that DRS, as a counting stat, doesn’t adjust for how many opportunities a given fielder has, so a pitcher who induces lots of strikeouts and fly balls will necessarily have DRS values smaller in magnitude than another pitcher of the same fielding ability but different pitching style.
Below is a histogram of pitcher fielding runs/150 IP for the population in question:
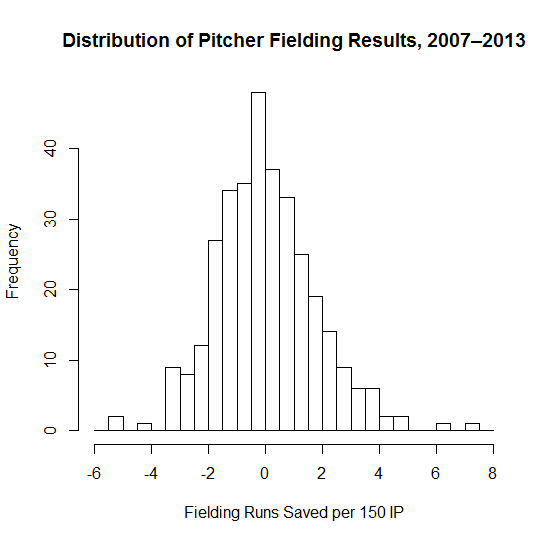
If you’re curious, the extreme positive values are Greg Maddux and Jake Westbrook, and the extreme negative values are Philip Humber, Brandon League, and Daniel Cabrera.
This raises another set of questions: what sort of pitchers tend to be better fielders? To test this, I decided to use linear regression—not because I want to make particularly nuanced predictions using the estimates, but because it is a way to examine how much of a correlation remains between fielding and a given variable after controlling for other factors. Most of the rest of the post will deal with the regression methods, so feel free to skip to the bold text at the end to see what my conclusions were.
What jumped out to me initially, is that Buehrle, R.A. Dickey, Westbrook, and Maddux are all extremely good fielding pitchers that aren’t hard throwers; to that end, I included their average velocity as one of the independent variables in the regression. (Hence the restriction to the PitchF/X era.) To control for the fact that harder throwers also strike out more batters and thus don’t have as many opportunities to make plays, I included the pitcher’s strikeouts per nine IP as a control as well.
It also seems plausible to me that there might be a handedness effect or a starter/reliever gap, so I added indicator variables for those to the model as well. (Given that righties and relievers throw harder than lefties and starters, controlling for velocity is key. Relievers are defined as those with at least half their innings in relief.) I also added in ground ball rate, with the thought that having more plays to make could have a substantial effect on the demonstrated fielding ability.
There turns out to be a noticeable negative correlation between velocity and fielding ability. This doesn’t surprise me, as it’s consistent with harder throwers having a longer, more intense delivery that makes it harder for them to react quickly to a line drive or ground ball. According to the model, we’d associate each mile per hour increase with a 0.2 fielding run per season decrease; however, I’d shy away from doing anything with that estimate given how poor the model is. (The R-squared values on the models discussed here are all less than 0.2, which is not very good.) Even if we take that estimate at face value, though, it’s a pretty small effect, and one that’s hard to read much into.
We don’t see any statistically significant results for K/9, handedness, or starter/reliever status. (Remember that this doesn’t take into account runs saved through stolen base prevention; in that case, it’s likely that left handers will rate as superior and hard throwers will do better due to having a faster time to the plate, but I’ll save that for another post.) In fact, of the non-velocity factors considered, only ground ball rate has a significant connection to fielding; it’s positively related, with a rough estimate that a percentage point increase in groundball rate will have a pitcher snag 0.06 extra fielding runs per 150 innings. That is statistically significant, but it’s a very small amount in practice and I suspect it’s contaminated by the fact that an increase in ground ball rate is related to an increase in fielding opportunities.
To attempt to control for that contamination, I changed the model so that the dependent (i.e. predicted) variable was [fielding runs / (IP/150 * GB%)]. That stat is hard to interpret intuitively (if you elide the batters faced vs. IP difference, it’s fielding runs per groundball), so I’m not thrilled about using it, but for this single purpose it should be useful to help figure out if ground ball pitchers tend to be better fielders even after adjusting for additional opportunities.
As it turns out, the same variables are significant in the new model, meaning that even after controlling for the number of opportunities GB pitchers and soft tossers are generally stronger fielders. The impact of one extra point of GB% is approximately equivalent to losing 0.25 mph off the average pitch speed; however, since pitch speed has a pretty small coefficient we wouldn’t expect either of these things to have a large impact on pitcher fielding.
This was a lot of math to not a huge effect, so here’s a quick summary of what I found in case I lost you:
- Harder throwers contribute less on defense even after controlling for having fewer defensive opportunities due to strikeouts. Ground ball pitchers contribute more than other pitchers even if you control for having more balls they can make plays on.
- The differences here are likely to be very small and fairly noisy (especially if you remember that the DRS numbers themselves are a bit wonky), meaning that, while they apply in broad terms, there will be lots and lots of exceptions to the rule.
- Handedness and role (i.e. starter/reliever) have no significant impact on fielding contribution.
All told, then, we shouldn’t be too surprised Buehrle is a great fielder, given that he doesn’t throw very hard. On the other hand, though, there are plenty of other soft tossers who are minus fielders (Freddy Garcia, for instance), so it’s not as though Buehrle was bound to be good at this. To me, that just makes him a little bit quirkier and reminds me of why I’ll have a soft spot for him above-and-beyond what he got just for being a great hurler for the Sox.

More Buehrle quirks: a perfect game (w/ the legendary Dewayne Wise catch at the wall after coming on as a defensive substitution in the 9th), a no-hitter in which he faced the minimum # of batters (walked a batter and then picked him off), has hit a home run, got his first career save in the World Series (after starting the previous game), and a complete game in the ALCS.
I wish he was still with the Sox but I’m glad to see him succeeding in Toronto this year.