Category Archives: Oddities

Rookie Umpires and the Strike Zone

Summary: Based on a suggestion heard at SaberSeminar, I use a few different means to examine how rookie umpires call the strike zone. Those seven umpires appear to consistently call more low strikes than the league as a whole, but some simple statistics suggest it’s unlikely they are actually moving the needle.


Red Sox manager John Farrell was one of the speakers at Saberseminar, which I attended last weekend. As I mentioned in my recap, he was asked about the reasons offense is down a hair this year (4.10 runs per team per game as I type this, down from 4.20 through this date (4.17 overall) in 2013). He mentioned a few things, but one that struck me was his suggestion that rookie umpires calling a larger “AAA strike zone” might have something to do with it.

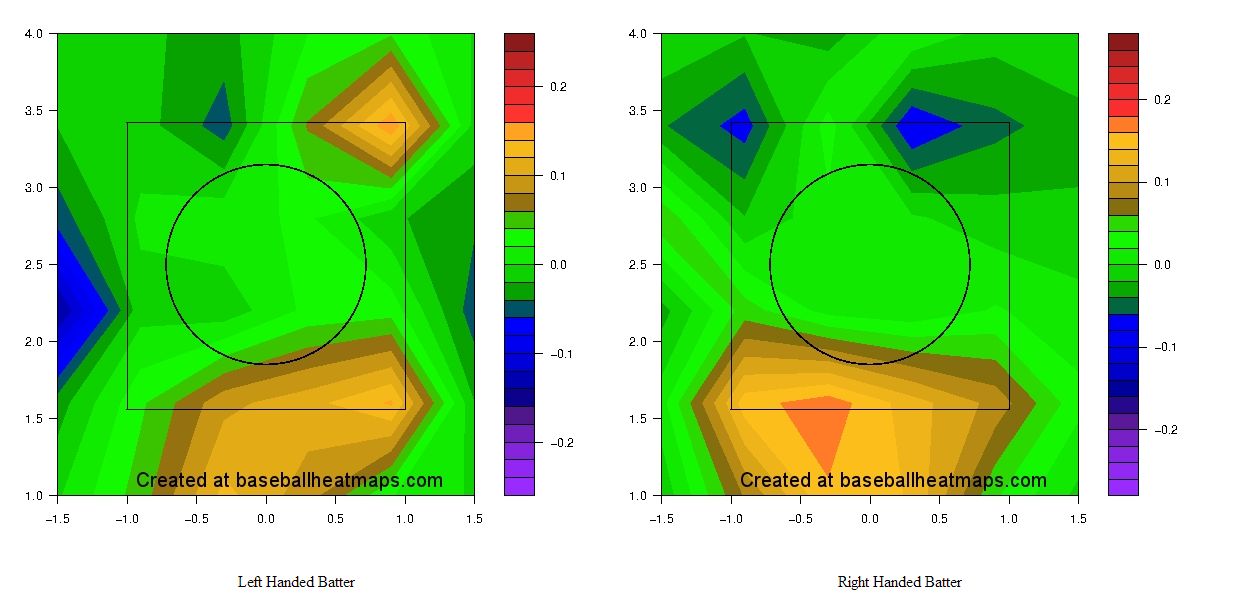
Of course, that’s something we can examine using some empirical evidence. Using this Hardball Talk article as a guide, I identified the seven new umpires this year. (Note that they are new to being full-fledged umps, but had worked a number of games as substitutes over the last several years.) I then pulled umpire strike zone maps from the highly useful Baseball Heat Maps, which I’ve put below. Each map shows the comparison between the umpire* and league average, with yellow marking areas more likely to be called strikes and blue areas less likely to be called strikes by the umpire.

* I used the site’s settings to add in 20 pitches of regression toward the mean, meaning that the values displayed in the charts are suppressed a bit.

Jordan Baker:

Jordan Baker

Lance Barrett:

Lance Barrett

Cory Blaser:

Cory Blaser

Mike Estabrook:

Mike Estabrook

Mike Muchlinski:

Mike Muchlinski

David Rackley:

David Rackley

D.J. Reyburn:

D.J. Reyburn


The common thread, to me, is that almost all of them call more pitches for strikes at the bottom of the zone, and most of them take away outside strikes for some batters. Unfortunately, these maps don’t adjust for the number of pitches thrown in each area, so it’s hard to get aggregate figures for how many strikes below or above average the umpires are generating. The two charts below, from Baseball Savant, are a little more informative; red dots are the bars corresponding to rookie umps. (Labeling was done by hand in MS Paint, so there may be some error involved.)

Called Strikes Out of ZoneCalled Balls in Zone

The picture is now a bit murkier; just based on visual inspection, it looks like rookie umps call a few strikes more than average on pitches outside the zone, and maybe call a few extra balls on pitches in the zone, so we’d read that as nearly a wash, but maybe a bit on the strike side.

So, we’ve now looked at their strike zones adjusted for league average but not the number of pitches thrown and their strike zones adjusted for the relative frequencies of pitches but not seriously adjusted for league average. One more comparison, since I wasn’t able to find a net strikes leaderboard, is to use aggregate ball/strike data, which has accurate numbers but is unadjusted for a bunch of other stuff. Taking that information from Baseball Prospectus and subtracting balls in play from their strikes numbers, I find that rookie umps have witnessed in total about 20 strikes more than league average would suggest, though that’s not accounting for swinging vs. called or the location that pitches were thrown. (Those are substantial things to consider, and I wouldn’t necessarily expect them to even out in 30 or so games.)

At 0.12 runs per strike (a figure quoted by Baseball Info Solutions at the conference) that’s about 2.4 runs, which is about 0.4% of the gap between this year’s scoring and last year’s. (For what it’s worth, BIS showed the umpires who’d suppressed the most offense with their strike zones, and if I remember correctly, taking the max value and applying it to each rookie would be 50–60 total runs, which is still way less than the total change in offense.)

A different way of thinking about it is that the rookie umps have worked 155 games, so they’ve given up an extra strike every 8 or so games, or every 16 or so team-games. If the change in offense is 0.07 runs per team-game, that’s about one strike per game. So these calculations, heavily unadjusted, suggest that rookie umpires are unlikely to account for much of the decrease in scoring.

So, we have three different imperfect calculations, plus a hearsay back of the envelope plausibility analysis using BIS’s estimates, that each point to a very small effect from rookie umps. Moreover, rookie umps have worked 8.3% of all games and 8.7% of Red Sox games, so it seems like an odd thing for Farrell to pick up on. It’s possible that a more thorough analysis would reveal something big, but based on the data easily available I don’t think it’s true that rookie umpires are affecting offense with their strike zones.

Advertisement

A Little Bit on FIP-ERA Differential

Brief Summary:

Fielding Independent Pitching (FIP) is a popular alternative to ERA predicated on a pitcher’s strikeout, walk, and home run rates. The extent to which pitchers deserve credit for having FIPs better or worse than ERAs is something that’s poorly understood, though it’s usually acknowledged that certain pitchers do deserve that credit. Given that some of the non-random difference can be attributed to where a pitcher plays because of defense and park effects, I look at pitchers who change teams and consider the year-over-year correlation between their ERA-FIP differentials. I find that the correlation remains and is not meaningfully different from the year-over-year correlation for pitchers that stay on the same team. However, this effect is (confusingly) confounded with innings pitched.


After reading this Lewie Pollis article on Baseball Prospectus, I started thinking more about how to look at FIP and other ERA estimators. In particular, he talks about trying to assess how likely it is that a pitcher’s “outperforming his peripherals” (scare quotes mine) is skill or luck. (I plan to run a more conceptual piece on that FIP and other general issues soon.) That also led me to this FanGraphs community post on FIP, which I don’t think is all that great (I think it’s arguing against a straw man) but raises useful points about FIP regardless.

After chewing on all of that, I had an idea that’s simple enough that I was surprised nobody else (that I could find) had studied it before. Do pitchers preserve their FIP-ERA differential when they change teams? My initial hypothesis is that they shouldn’t, at least not to the same extent as pitchers who don’t change teams. After all, in theory (just to make it clear: in theory) most or much of the difference between FIP and ERA should be related to park and defensive effects, which will change dramatically from team to team. (To see an intuitive demonstration of this, look at the range of ERA-FIP values by team over the last decade, where each team has a sample of thousands of innings. The range is half a run, which is substantial.)

Now, this is dramatically oversimplifying things—for one, FIP, despite its name, is going to be affected by defense and park effects, as the FanGraphs post linked above discusses, meaning there are multiple moving parts in this analysis. There’s also the possibility that there’s either selection bias (pitchers who change teams are different from those who remain) or some treatment effect (changing teams alter’s a pitcher’s underlying talent). Overall, though, I still think it’s an interesting question, though you should feel free to disagree.

First, we should frame the question statistically. In this case, the question is: does knowing that a pitcher changed teams give us meaningful new information about his ERA-FIP difference in year 2 above and beyond his ERA-FIP difference in year 1. (From here on out, ERA-FIP difference is going to be E-F, as it is on FanGraphs.)

I used as data all consecutive pitching seasons of at least 80 IP since 1976. I’ll have more about the inning cutoff in a little bit, but I chose 1976 because it’s the beginning of the free agency era. I said that a pitcher changed teams if they played for one team for all of season 1 and another team for all of season 2; if they changed teams midseason in either season, they were removed from the data for most analyses. I had 621 season pairs in the changed group and 3389 in the same team group.

I then looked at the correlation between year 1 and year 2 E-F for the two different groups. For pitchers that didn’t change teams, the correlation is 0.157, which ain’t nothing but isn’t practically useful. In a regression framework, this means that the fraction of variation in year 2 E-F explained by year 1 E-F is about 2.5%, which is almost negligible. For pitchers who changed teams, the correlation is 0.111, which is smaller but I don’t think meaningfully so. (The two correlations are also not statistically significantly different, if you’re curious.)

Looking at year-to-year correlations without adjusting for anything else is a very blunt way of approaching this problem, so I don’t want to read too much into a null result, but I’m still surprised—I would have thought there would be some visible effect. This still highlights one of the problems with the term Fielding Independent Pitching—the fielders changed, but there was still an (extremely noisy) persistent pitcher effect, putting a bit of a lie to the term “independent” (though as before, there are a lot of confounding factors so I don’t want to overstate this). At some point, I’d like to thoroughly examine how much of this result is driven by lucky pitchers getting more opportunities to keep pitching than unlucky ones, so that’s one for the “further research” pile.

I had two other small results that I ran across while crunching these numbers that are tangentially related to the main point:

  1. As I suspected above, there’s something different about pitchers who change teams compared to those who don’t. The average pitcher who didn’t change teams had an E-F of -0.10, meaning they had a better ERA than FIP. The average pitcher who did change teams had an E-F of 0.05, meaning their FIP was better than their ERA. The swing between the two groups is thus 0.15 runs, which over a few thousand pitchers is pretty big. There’s going to be some survivorship bias in this, because having a positive ERA-FIP might be related to having a high ERA, which makes one less likely to pitch 80 innings in the second season and thus more likely to drop out of my data. Regardless, though, that’s a pretty big difference and suggests something odd is happening in the trade and free agency markets.
  2. There’s a strong correlation between innings pitched in both year 1 and year 2 and E-F in year two for both groups of pitchers. Specifically, each 100 innings pitched in year 1 is associated with a 0.1 increase in E-F in year 2, and each 100 innings pitched in year 2 is associated with a 0.2 decrease in E-F in year 2. I can guess that the second one is happening because lower/negative E-F is going to be related to low ERAs, which get you more playing time, but I find the first part pretty confusing. Anyone who has a suggestion for what that means, please let me know.

So, what does this all signify? As I said before, the result isn’t what I expected, but when working with connections that are this tenuous, I don’t think there’s a clear upshot. This research has, however, given me some renewed skepticism about the way FIP is often employed in baseball commentary. I think it’s quite useful in its broad strokes, but it’s such a blunt instrument that I would advise being wary of people who try to draw strong conclusions about its subtleties. The process of writing the article has also churned up some preexisting ideas I had about FIP and the way we talk about baseball stats in general, so stay tuned for those thoughts as well.

Do High Sock Players Get “Hosed” by the Umpires?

I was reading one of Baseball Prospectus’s collections this morning and came across an interesting story. It’s a part of baseball lore that Willie Mays started his career on a brutal cold streak (though one punctuated by a long home run off Warren Spahn). Apparently, manager Leo Durocher told Mays toward the end of the slump that he needed to pull his pants up because the pant knees were below Mays’s actual knees, which was costing him strikes. Mays got two hits the day after the change and never looked back.

To me, this is a pretty great story and (to the extent it’s true) a nice example of the attention to detail that experienced athletes and managers are capable of. However, it prompted another question: do uniform details actually affect the way that umpires call the game?

Assessing where a player belts his pants is hard, however, so at this point I’ll have to leave that question on the shelf. What is slightly easier is looking at which hitters wear their socks high and which cover their socks with their baseball pants. The idea is that by clearly delineating the strike zone, the batter will get fairer calls on balls near the bottom of the strike zone than he might otherwise. This isn’t a novel idea—besides the similarity to what Durocher said, it’s also been suggested herehere, and in the comments here—but I wasn’t able to find any studies looking at this. (Two minor league teams in the 1950s did try this with their whole uniforms instead of just the socks, however. The experiments appear to have been short-lived.)

There are basically two ways of looking at the hypothesis: the first is that it will be a straightforward benefit/detriment to the player to hike his socks because the umpire will change his definition of the bottom of the zone; this is what most of the links I cited above would suggest, though they didn’t agree on which direction. I’m somewhat skeptical of this, unless we think that the umpires have a persistent bias for or against certain players and that that bias would be resolved by the player changing how he wears his socks. The second interpretation is that it will make the umpire’s calls more precise, meaning simply that borderline pitches are called more consistently, but that it won’t actually affect where the umpire thinks the bottom of the zone is.

At first blush, this seems like the sort of thing that Pitch F/X would be perfectly suited to, as it gives oodles of information about nearly every pitch thrown in the majors in the last several years. However, it doesn’t include a variable for the hosiery of the batter, so to do a broader study we need additional data. After doing some research and asking around, I wasn’t able to find a good database of players that consistently wear high socks, much less a game-by-game list, which basically ruled out a large-scale Pitch F/X study.

However, I got a very useful suggestion from Paul Lukas, who runs the excellent Uni Watch site. He pointed out that a number of organizations require their minor leaguers to wear high socks and only give the option of covered hose to the major leaguers, providing a natural means of comparison between the two types of players. This will allow us to very broadly test the hypothesis that there is a single direction change in how low strikes are called.

I say very broadly because minor league Pitch F/X data aren’t publicly available, so we’re left with extremely aggregate data. I used data from Minor League Central, which has called strikes and balls for each batter. In theory, if the socks lead to more or fewer calls for the batter at the bottom of the zone, that will show up in the aggregate data and the four high-socked teams (Omaha, Durham, Indianapolis, and Scranton/Wilkes-Barre) will have a different percentage of pitches taken go for strikes. (I found those teams by looking at a sample of clips from the 2013 season; their AA affiliates also require high socks.)  Now, there are a lot of things that could be confounding factors in this analysis:

  1. Players on other teams are allowed to wear their socks high, so this isn’t a straight high socks/no high socks comparison, but rather an all high socks/some high socks comparison. (There’s also a very limited amount of non-compliance on the all socks side, as based on the clips I could find it appears that major leaguers on rehab aren’t bound by the same rules; look at some Derek Jeter highlights with Scranton if you’re curious.)
  2. AAA umpires are prone to more or different errors than major league umpires.
  3. Which pitches are taken is a function of the team makeup and these teams might take more or fewer balls for reasons unrelated to their hose.
  4. This only affects borderline low pitches, and so it will only make up a small fraction of the overall numbers we observe and the impact will be smothered.

I’m inclined to downplay the first and last issues, because if those are enough to suppress the entire difference over the course of a whole season then the practical significance of the change is pretty small. (Furthermore, for #1, from my research it didn’t look like there were many teams with a substantial number of optional socks-showers. Please take that with a grain of salt.)

I don’t really have anything to say about the second point, because it has to do with extrapolation, and for now I’d be fine just looking at AAA. I don’t have even have that level of brushoff response for the third point except to wave my hands and say that I hope it doesn’t matter given that these reflect pitches thrown by the rest of the league, so they will hopefully converge around league average.

So, having substantially caveated my results…what are they? As it turns out, the percentage of pitches the stylish high sock teams took that went for strikes was 30.83% and the equivalent figure for the sartorially challenged was…30.83%. With more than 300,000 pitches thrown in AAA last year, you need to go to the seventh decimal place of the fraction to see a difference. (If this near equality seems off to you, it does to me as well. I checked my figures a couple of ways, but I (obviously) can’t rule out an error here.)

What this says to me is that it’s pretty unlikely that this ends up mattering, unless there is an effect and it’s exactly cancelled out by the confounding factors listed above (or others I failed to consider). That can’t be ruled out as a possibility, nor can data quality issues, but I’m comfortable saying that the likeliest possibility by a decent margin is that socks don’t lead to more or fewer strikes being called against the batter. (Regardless, I’m open to suggestions for why the effect might be suppressed or analysis based on more granular data I either don’t have access to or couldn’t find.)

What about the accuracy question, i.e. is the bottom of the strike zone called more consistently or correctly for higher-socked players? Due to the lack of nicely collected data, I couldn’t take a broad approach to answering this, but I do want to record an attempt I made regardless. David Wright is known for wearing high socks in day games but covering his hosiery at night, which gives us a natural experiment we can look at for results.

I spent some amount of time looking at the 2013 Pitch F/X data for his day/night splits on taken low pitches and comparing those to the same splits for the Mets as a whole, trying a few different logistic regression models as well as just looking at the contingency tables to see if anything jumped out, and nothing really did in terms of either greater accuracy or precision. I didn’t find any cuts of the data that yielded a sufficiently clean comparison or sample size that I was confident in the results. Since this is a messy use of these data in the first place (it relies on unreliable estimates of the lower edge of a given batter’s strike zone, for instance), I’m going to characterize the analysis as incomplete for now. Given a more rigorous list of which players wear high socks and when, though, I’d love to redo this with more data.

Overall, though, there isn’t any clear evidence that the socks do influence the strike zone. I will say, though, that this seems like something that a curious team could test by randomly having players (presumably on their minor league teams) wear the socks high and doing this analysis with cleaner data. It might be so silly as to not be worth a shot, but if this is something that can affect the strike zone at all then it could be worthwhile to implement in the long run—if it can partially negate pitch framing, for instance, then that could be quite a big deal.

Adrian Nieto’s Unusual Day

White Sox backup catcher Adrian Nieto has done some unusual things in the last few days. To start with, he made the team. That doesn’t sound like much, but as a Rule 5 draft pick, it’s a bit more meaningful than it might be otherwise, and it’s somewhat unusual because he was jumping from A ball to the majors as a catcher. (Sox GM Rick Hahn said he didn’t know of anyone who’d done it in the last 5+ years.)

Secondly, he pinch ran today against the Twins, which is an activity not usually associated with catchers (even young ones). This probably says more about the Sox bench, as he pinch ran for Paul Konerko, who is the worst baserunner by BsR among big league regulars this decade by a hefty margin. Still: a catcher pinch running! How often does this happen?

More frequently than I thought, as it turns out; there were 1530 instances of a catcher pinch running from 1974 to 2013, or roughly 38 times a year. This is about 4% of all pinch running appearances over that time, so it’s not super common, but it’s not unheard of either. (My source for this is the Lahman database, which is why I have the date cutoff. For transparency’s sake, I called a player a catcher if he played catcher in at least half of his appearances in a given year.)

If you connect the dots, though, you’ll realize that Nieto is a catcher made his major league debut as a pinch runner. How often does that happen? As it turns out, just five times previously since 1974 (cross-referencing Retrosheet with Lahman):

  • John Wathan, Royals; May 26, 1976. Wathan entered for pinch hitter Tony Solaita, who had pinch hit for starter Bob Stinson. He came around to score on two hits (though he failed to make it home from third after a flyball to right), but he also grounded into a double play with the bases loaded in the 9th. The Royals lost in extra innings, but he lasted 10 years with them, racking up 5 rWAR.
  • Juan Espino, Yankees; June 25, 1982. Espino pinch ran for starter Butch Wynegar with the Yankees up 11-3 in the 7th and was forced at second immediately. He racked up -0.4 rWAR in 49 games spread across four seasons, all with the Yanks.
  • Doug Davis, Angels, July 8, 1988. This one’s sort of cheating, as Davis entered for third baseman Jack Howell after a hit by pitch and stayed in the game at the hot corner; he scored that time around, then made two outs further up. According to the criteria I threw out earlier, though, he counts, as three of the six games he played in that year were at catcher (four of seven lifetime).
  • Gregg Zaun, Orioles; June 24, 1995. Zaun entered for starter Chris Hoiles with the O’s down 3-2 in the 7th. He moved to second on a groundout, then third on a groundout, then scored the tying run on a Brady Anderson home run. Zaun had a successful career as a journeyman, playing for 9 teams in 16 years and averaging less than 1 rWAR per year.
  • Andy Stewart, Royals; September 6, 1997. Ran for starter Mike McFarlane in the 8th and was immediately wiped out on a double play. Stewart only played 5 games in the bigs lifetime.

So, just by scoring a run, Nieto didn’t necessarily have a more successful debut than this cohort. However, as a Sox fan I’m hoping (perhaps unreasonably) that he has a bit better career than Davis, Stewart, and Espino–and hey, if he’s a good backup for 10 or more years, that’s just gravy.

One of my favorite things about baseball is the number of quirky things like this that happen, and while this one wasn’t unique, it was pretty close. When you have low expectations for a team (like this year’s White Sox), you just hope the history they make isn’t too embarrassing.

Throne of Games (Most Played, Specifically)

I was trawling for some stats on hockey-reference (whence most of the hockey facts in this post) the other day and ran into something unexpected: Bill Guerin’s 2000-01 season. Specifically, Guerin led the league with 85 games played. Which wouldn’t have seemed so odd, except for the fact that the season is 82 games long.

How to explain this? It turns out there are two unusual things happening here. Perhaps obviously, Guerin was traded midseason, and the receiving team had games in hand on the trading team. Thus, Guerin finished with three games more than the “max” possible.

Now, is this the most anyone’s racked up? Like all good questions, the answer to that is “it depends.” Two players—Bob Kudelski in 93-94 and Jimmy Carson in 92-93—played 86 games, but those were during the short span of the 1990s when each team played 84 games in a season, so while they played more games than Guerin, Guerin played in more games relative to his team. (A couple of other players have played 84 since the switch to 82 games, among them everyone’s favorite Vogue intern, Sean Avery.)

What about going back farther? The season was 80 games from 1974–75 to 1991–92, and one player in that time managed to rack up 83: the unknown-to-me Brad Marsh, in 1981-82, who tops Guerin at least on a percentage level. Going back to the 76- and 78-game era from 1968-74, we find someone else who tops Guerin and Marsh, specifically Ross Lonsberry, who racked up 82 games (4 over the team maximum) with the Kings and Flyers in 1971–72. (Note that Lonsberry and Marsh don’t have game logs listed at hockey-reference, so I can’t verify if there was any particularly funny business going on.) I couldn’t find anybody who did that during the 70 game seasons of the Original Six era, and given how silly this investigation is to begin with, I’m content to leave it at that.

What if we go to other sports? This would be tricky in football, and I expect it would require being traded on a bye week. Indeed, nobody has played more than the max games at least since the league went to a 14 game schedule according to the results at pro-football-reference.

In baseball, it certainly seems possible to get over the max, but actually clearing this out of the data is tricky for the following two reasons:

  • Tiebreaker games are counted as regular season games. Maury Wills holds the raw record for most games played with 165 after playing in a three game playoff for the Dodgers in 1962.
  • Ties that were replayed. I started running into this a lot in some of the older data: games would be called after a certain number of innings with the score tied due to darkness or rain or some unexplained reason, and the stats would be counted, but the game wouldn’t count in the standings. Baseball is weird like that, and no matter how frustrating this can be as a researcher, it was one of the things that attracted me to the sport in the first place.

So, those are my excuses if you find any errors in what I’m about to present; I used FanGraphs and baseball-reference to spot candidates. I believe there’s only been a few cases of baseball players playing more than the scheduled number of games when none of the games fell into those two problem categories mentioned above. The most recent is Todd Zeile, who, while he didn’t play in a tied game, nevertheless benefited from one. In 1996, he was traded from the Phillies to the Orioles after the O’s had stumbled into a tie, thus giving him 163 games played, though they all counted.

Possibly more impressive is Willie Montanez, who played with the Giants and Braves in 1976. He racked up 163 games with no ties, but arguably more impressive is that, unlike Zeile, Montanez missed several opportunities to take it even farther. He missed one game before being traded, then one game during the trade, and then two games after he was traded. (He was only able to make it to 1963 because the Braves had several games in hand on the Giants at the time of the trade.)

The only other player to achieve this feat in the 162 game era is Frank Taveras, who in 1979 played in 164 games; however, one of those was a tie, meaning that according to my twisted system he only gets credit for 163. He, like Montanez, missed an opportunity, as he had one game off after getting traded.

Those are the only three in the 162-game era. While I don’t want to bother looking in-depth at every year of the 154-game era due to the volume of cases to filter, one particular player stands out. Ralph Kiner managed to put up 158 games with only one tie in 1953, making him by my count the only baseball player to play three meaningful games more than his team did in baseball since 1901.

Now, I’ve sort of buried the lede here, because it turns out that the NBA has the real winners in this category. This isn’t surprising, as the greater number of days off between games means it’s easier for teams to get out of whack and it’s more likely than one player will play in every game. Thus, a whole host of players have played more than 82 games, led by Walt Bellamy, who put up 88 in 1968-69. While one player got to 87 since, and a few more to 86 and 85, Bellamy stands alone atop the leaderboard in this particular category. (That fact made it into at least one of his obituaries.)

Since Bellamy is the only person I’ve run across to get 6 extra games in a season and nobody from any of the other sports managed even 5, I’m inclined to say that he’s the modern, cross-sport holder of this nearly meaningless record for most games played adjusted for season length.

Ending on a tangent: one of the things I like about sports records in general, and the sillier ones in particular, is trying to figure out when they are likely to fall. For instance, Cy Young won 511 games playing a sport so different from contemporary baseball that, barring a massive structural change, nobody can come within 100 games of that record. On the other hand, with strikeouts and tolerance for strikeouts at an all-time high, several hitter-side strikeout records are in serious danger (and have been broken repeatedly over the last 15 years).

This one seems a little harder to predict, because there are factors pointed in different directions. On the one hand, players are theoretically in better shape than ever, meaning that they are more likely to be able to make it through the season, and being able to play every game is a basic prerequisite for playing more than every game. On the other, the sports are a lot more organized, which would intuitively seem to decrease the ease of moving to a team with meaningful games in hand on one’s prior employer. Anecdotally, I would also guess that teams are less likely to let players play through a minor injury (hurting the chances). The real wild card is the frequency of in-season trades—I honestly have no rigorous idea of which direction that’s trending.

So, do I think someone can take Bellamy’s throne? I think it’s unlikely, due to the organizational factors laid out above, but I’ll still hold out hope that someone can do it—or at least, finding new players to join the bizarre fraternity of men playing more games than their teams.

Casey Stengel: Hyperbole Proof

Today, as an aside in Jayson Stark’s column about replay:

“I said, ‘Just look at this as something you’ve never had before,'” Torre said. “And use it as a strategy. … And the fact that you only have two [challenges], even if you’re right — it’s like having a pinch hitter.’ Tony and I have talked about it. It’s like, ‘When are you going to use this guy?'”

But here’s the problem with that analogy: No manager would ever burn his best pinch hitter in the first inning, right? Even if the bases were loaded, and Clayton Kershaw was pitching, and you might never have a chance this good again.

No manager would do that? In the same way that no manager would ramble on and on when speaking before the Senate Antitrust Subcommittee. That is to say, Casey Stengel would do it. Baseball Reference doesn’t have the best interface for this, and it would have taken me a while to dig this out of Retrosheet, but Google led me to this managerial-themed quiz, which led me in turn to the Yankees-Tigers game from June 10, 1954. Casey pinch hit in the first inning—twice! I’m sure there are more examples of this, but this was the first one I could find.

Casey Stengel: great manager, and apparently immune to rhetorical questions.

The Joy of the Internet

One of the things I love about the Internet is that you can use the vast amounts of information to research really minor trivia from pop culture and sports. In particular, there’s something I find charming about the ability to identify exact sporting (or other) moments from various works of fiction—for instance, Ice Cube’s good day and the game Ferris Bueller attended.

I bring this up because I finally started watching The Wire (it’s real good, you should watch it too) and, in a scene from the Season 3 premiere, McNulty and Bunk go to a baseball game with their sons. This would’ve piqued my interest regardless, because it’s baseball and because it’s Camden Yards, but it’s also a White Sox game, and since the episode came out a year before the White Sox won the series, it features some players that I have fond memories of.

So, what game is it? As it turns out, we only need information about the players shown onscreen to make this determination. For starters, Carlos Lee bats for the Sox:

Carlos Lee

This means the game can’t take place any later than 2004, as Lee was traded after the season. (Somewhat obvious, given that the episode was released in 2004, but hey, I’m trying to do this from in-universe clues only.) Who is that who’s about to go after the pop up?

Javy Lopez

Pretty clearly Javy Lopez:

Lopez Actual

Lopez didn’t play for the O’s until 2004, so we have a year locked down. Now, who threw the pitch?

Sidney Ponson

Sidney Ponson, everyone’s favorite overweight Aruban pitcher! Ponson only pitched in one O’s-Sox game at Camden Yards in 2004, so that’s our winner: May 5, 2004. A White Sox winner, with Juan Uribe having a big triple, Billy Koch almost blowing the save, and Shingo Takatsu—Mr. Zero!—getting the W.

One quick last note—a quick Google reveals that I’m far from the first person to identify this scene and post about it online, but I figured it’d be good for a light post and hey, I looked it up myself before I did any Googling.

Tied Up in Knots

Apologies for the gap between posts–travel and whatnot. I’ll hopefully have some shiny new content in the future. A narrow-minded, two part post inspired by the Bears game against the Vikings today:

Part I: The line going into the game was pick ’em, meaning no favorite. This means that a tie (very much on the table) would have resulted in a push. Has a tie game ever resulted in a push before?

As it turns out, using Pro Football Reference’s search function, there have been 19 ties since the overtime rule was introduced in the NFL in 1974, and none of them were pick ’em. (Note: PFR only has lines going back to the mid-1970s, so for two games I had to find out if there was a favorite from a Google News archive search.) (EDIT: Based on some search issues I’ve had, PFR may not list any games as pick ’ems. However, all of the lines were at least 2.5 points, so if there’s a recording error it isn’t responsible for this.)

Part II has to do with ties, specifically consecutive ones. Since 1974, unsurprisingly, no team has tied consecutive games. Were the Vikings, who were 24 seconds 1:47 shy of a second tie, the closest?

Only two teams before the Vikes have even had a stretch of two overtime games with one tie, both in 1986. The Eagles won a game on a QB sneak at 8:07 of OT a week before their tie, in a game that seems very odd now–the Raiders fumbled at the Philly 15 and had it taken back to the Raiders’ 4, after which the Eagles had Randall Cunningham punch it in. Given that the coaches today chose to go with field goal tries of 45+ even before 4th down, it’s clear that risk calculations with respect to kicking have changed quite a bit.

As for the other team, the 49ers lost on a field goal less than four minutes into overtime the week before their 1986 tie. Thus, the Vikings seem to have come well closer to consecutive ties than any other team since the merger.

Finally, a crude estimate of the probability a team would tie two consecutive games in a row. (Caveats follow at the end of the piece.) Assuming everything is independent (though realistically it’s not), we figure a tie occurs roughly 0.207% of the time, or roughly 2 ties for every thousand games played. Once again assuming independence (i.e. that a team that has tied once is no more likely to tie than any other), we figure the probability of consecutive ties in any given pair of games to be 0.0004%, or 1 in 232,000. Given the current status of an 32 team league in which each team plays 16 games, there are 480 such pairs of games per year.

Ignoring the fact that a tie has to have two teams (not a huge deal given the small probabilities we’re talking about), we would figure there is about a 0.2% chance that a team in the NFL will have two consecutive ties in a given year, meaning that we’d expect 500 seasons in the current format to be played before we get a streak like that.

I’ll note (warning: dull stuff follows) that there are some probably silly assumptions that went into these calculations, some of which—the ones relating to independence—I’ve already mentioned. I imagine that baseline tie rate is probably wrong, and I imagine it’s high. I can think of two things that would make me underestimate the likelihood of a tie: one is the new rules, which by reducing the amount of sudden death increase the probability that teams tie. The other is that I’ve assumed there’s no heterogeneity across teams in tie rates, and that’s just silly—a team with a bad offense and good defense, i.e. one that plays low scoring games, is more likely to play close games and more likely to have a scoreless OT. Teams that play outside, given the greater difficulty of field goal kicking, probably have a similar effect. Some math using Jensen’s inequality tells us that the heterogeneity will probably increase the likelihood that one team will do it.

However, those two changes will have a much smaller impact, I expect, than that of increasing field goal conversion rates and a dramatic increase in both overall points scored and the amount of passing that occurs, which makes it easier for teams to get more possessions in one OT. Given the extreme rarity of the tie, I don’t know how to empirically verify these suppositions (though I’d love to see a good simulation of these effects, but I don’t know of anyone who has one for this specific a scenario), but I’ll put it this way: I wouldn’t put money down at 400-1 that a team would tie twice in a row in a given year. I don’t even think I’d do it at 1000-1, but I’d certainly think about it.

Don’t Wanna Be a Player No More…But An Umpire?

In my post about very long 1-0 games, I described one game that Retrosheet mistakenly lists as much longer than it actually was–a 1949 tilt between the Phillies and Cubbies. Combing through Retrosheet initially, I noticed that Lon Warneke was one of the umpires. Warneke’s name might ring a bell to baseball history buffs as he was one of the star pitchers on the pennant winning Cubs team of 1935, but I had totally forgotten that he was also an umpire after his playing career was up.

I was curious about how many other players had later served as umps, which led me to this page from Baseball Almanac listing all such players. As it turns out, one of the other umpires in the game discussed above was Jocko Conlan, who also had a playing career (though not nearly as distinguished as Warneke’s). This raises the question: how many games in major league history have had at least two former players serve as umpires?

The answer is 6,953–at least, that’s how many are listed in Retrosheet. (For reference, there have been ~205,000 games in major league history.) That number includes 96 postseason games as well. Most of those are pretty clustered, for the simple reason that umpires will ump most of their games in a given season with the same crew, so there won’t be any sort of uniformity.

The last time this happened was 1974, when all five games of the World Series had Bill Kunkel and Tom Gorman as two of the men in blue. (This is perhaps more impressive given that those two were the only player umps active at the time, and indeed the last two active period–Gorman retired in 1976, Kunkel in 1984.) The last regular season games with two player/umps were a four game set between the Astros and Cubs in August 1969, with Gorman and Frank Secory the umps this time.

So, two umpires who were players is not especially uncommon–what about more than that? Unfortunately, there are no games with four umpires that played, though four umpires in a regular season game didn’t become standard until the 1950s, and there were never more than 5-7 umps active at a time after that who’d been major league players. There have, however, been 102 games in which three umpires had played together–88 regular season and 14 postseason (coincidentally, the 1926 and 1964 World Series, both seven game affairs in which the Cardinals beat the Yankees).

That 1964 World Series was the last time 3 player/umps took the field at once, but that one deserves an asterisk, as there are 6 umps on the field for World Series games. The last regular season games of this sort were a two game set in 1959 and a few more in 1958. Those, however, were all four ump games, which is a little less enjoyable than a game in which all of the umps are former players.

That only happened 53 times in total (about 0.02% of all MLB games ever), last in October 1943 during the war. There’s not good information available about attendance in those years, but I have to imagine that the 1368 people at the October 2, 1943 game between the A’s and Indians didn’t have any inkling they were seeing this for the penultimate time ever.

Two more pieces of trivia about players-turned-umpires: only two of them have made the Hall of Fame–Jocko Conlan as an umpire (he only played one season), and Ed Walsh as a player (he only umped one season).

Finally, this is not so much a piece of trivia as it is a link to a man who owns the trivia category. Charlie Berry was a player and an ump, but was also an NFL player and referee who eventually worked the famous overtime 1958 NFL Championship game–just a few months after working the 1958 World Series. They don’t make ’em like that anymore, do they?

In Search of Losses/Time

While writing up the post about the 76ers’ run of success, something odd occurred to me. The record for most losses in a season is 73, set by the 1972-73 76ers. As you might notice, that means that their loss count matches the a year of their particularly putrid season. Per Basketball Reference, only one other team has done this: the expansion 1961-62 Chicago Packers. (Can you imagine having a team called the Packers in Chicago now? It’d be weird for a name to be shared by a city’s team and a rival of another team in that city, but I suppose that’s how it was for Brooklyn Dodgers fans in the 1940s and 1950s, and maybe for St. Louis fans when the NFC West heats up.)

That Packers team went 18-62, though BR says they were expected to finish at 21-59. The only player whose name I recognize is the recently deceased Walt Bellamy, who was a rookie that year. They only hung on in Chicago for one more year before moving to Baltimore. They also put up 111 points a game and gave up 119, because early 1960s basketball was pretty damned wild.

So, this is an exclusive club, if a little arbitrary–there are 4 other teams from the 20th century who lost more games than the corresponding year, and obviously every team from the 21st has lost more than the year. Still, it’s a set of 2 truly terrible teams, but the next member is presumably going to be one of the very best teams in the league in the next five years or so. The benchmark will only get more and more attainable, so club membership will rapidly devalue. Regardless, I can’t see the members of those two teams popping champagne like the 1972 Dolphins when the last team hits 14 losses this year–though it’d be hilarious if they did.