I have a post over at the Hardball Times today about a way to improve replay review. Check it out!
Does the Call Need to Stand?
Leave a reply
I have a post over at the Hardball Times today about a way to improve replay review. Check it out!
In the last piece I wrote, I mentioned that I have some concerns about the way that people tend to think about defense independent pitching statistics (DIPS), especially FIP. (Refresher: Fielding Independent Pitching is a metric commonly used as an ERA estimator based on a pitcher’s walk, strikeout, and HR numbers.) I’m writing this piece in part as a way for me to sort some of my thoughts on the complexities of defense and park adjustments, not necessarily to make a single point (and none of these thoughts are terribly original).
All of this analysis starts with this equation, which is no less foundational for being almost tautological: Runs Allowed = Fielding Independent Pitching + Fielding Dependent Pitching. (Quick aside: Fielding Independent Pitching refers both to a concept and a metric; in this article, I’m mostly going to be talking about the concept.) In other words, there are certain ways of preventing runs that don’t rely on getting substantial aid from the defense (strike outs, for instance), and certain ways that do (allowing soft contact on balls in play).
In general, most baseball analysts tend to focus on the fielding independent part of the equation. There are a number of good reasons for this, the primary two being that it’s much simpler to assess and more consistent than its counterpart. There’s probably also a belief that, because it’s more clearly intrinsic to the pitcher, it’s more worthwhile to understand the FI portion of pitching. There are pitchers for whom we shy away from using the FI stats (like knuckleballers), but if you look at the sort of posts you see on FanGraphs, they’ll mostly be talking about performance in those terms.
That’s not always (or necessarily ever) a problem, but it often omits an essential portion of context. To see how, look at these three overlapping ways of framing the question “how good has this pitcher been?”:
1) If their spot on their team were given to an arbitrary (replacement-level or average) pitcher, how much better or worse would the team be?
2) If we took this pitcher and put them on a hypothetically average team (average in terms of defense and park, at least), how much better or worse would that team be?
3) If we took this pitcher and put them on a specific other team, how much better or worse would that team be?
Roughly speaking, #2 is how I think of FanGraphs’ pitcher WAR. #1 is Baseball Reference’s WAR. I don’t know of anywhere that specifically computes #3, but in theory that’s what you should get out of a projection system like Baseball Prospectus’s PECOTA or the ZiPS numbers found at FanGraphs’. (In practice, my understanding is that the projections aren’t necessarily nuanced enough to work that out precisely.)
The thing, though, is that pitchers don’t work with an average park and defense behind them. You should expect a fly ball pitcher to post better numbers with the Royals and their good outfield defense and a ground ball pitcher to do worse in front the butchers playing in the Cleveland infield. From a team’s perspective, though, a run saved is a run saved, and who cares whether it’s credited to the defense, the pitcher, or split between the two? If Jarrod Dyson catches the balls sent his way, it’s good to have a pitcher who’s liable to have balls hit to him. In a nutshell, a player’s value to his team (or another team) is derived from the FIP and the FDP, and focusing on the FIP misses some of that. Put your players in the best position for them to succeed, as the philosophy often attributed to Earl Weaver goes.
There are a number of other ways to frame this issue, which, though I’ve been talking in terms of pitching, clearly extends beyond that into nearly all of the skills baseball players demonstrate. Those other frames are all basically a restatement of that last paragraph, so I’ll try to avoid belaboring the point, but I’ll add one more example. Let’s say you have two batters who are the same except for 5% of their at-bats, which are fly balls to left field for batter A and to right field for batter B. By construction, they are players of identical quality, but player B is going to be worth more in Cleveland, where those fly balls are much more likely to go out of the park. Simply looking at his wRC+ won’t give you that information. (My limited knowledge of fantasy baseball suggests to me that fantasy players, because they use raw stats, are more attuned to this.)
Doing more nuanced contextual analysis of the sort I’m advocating is quite tricky and is beyond my (or most people’s) ability to do quickly with the numbers we currently have available. I’d still love, though, to see more of it, with two things in particular crossing my mind.
One is in transaction analysis. I read a few pieces discussing the big Samardzija trade, for instance, and in none did they mention (even in passing) how his stuff is likely to play in Oakland given their defense and park situation. This isn’t an ideal example because it’s a trade with a lot of other interesting aspects to it, but in general, it’s something I wish I saw a bit more of—considering the amount of value a team is going out of a player after adjusting for park and defense factors. The standard way of doing this is to adjust things from his raw numbers to a neutral context, but bringing things one step further, though challenging, should add another layer of nuance. (I will say that in my experience you see such analyses a bit more with free agency analyses, especially of pitchers.)
The second is basically expanding what we think of as being park and defensive adjustments. This is likely impossible to do precisely without more data, but I’d love to see batted ball data used to get a bit more granular in the adjustments; for instance, dead pull hitters should be adjusted differently from guys who use the whole field. This isn’t anything new—it’s in the FanGraphs page explaining park factors—but it’s something that occasionally gets swept under the rug.
One last note, as this post gets ever less specific: I wonder how big the opportunity is for teams to optimize their lineups and rotations based on factors such as these—left-handed power hitters go against the Yankees, ground ball hitters against the Indians, etc. We already see this to some extent, but I’d be curious to see what the impact is. (If you can quantify how big an edge you’re getting on a batter-by-batter basis—a big if—you could run some simulations to quantify the gain from all these adjustments. It’s a complex optimization problem, but I doubt it’s impossible to estimate.)
One thing I haven’t seen that I’d love for someone to try is for teams with roughly interchangeable fourth, fifth, and sixth starters to juggle their pitching assignments each time through the order to get the best possible matchups with respect to park, opponent, and defense. Ground ball pitchers pitch at Comiskey, for instance, and fly ball pitchers start on days when your best outfield is out there. I don’t know how big the impact is, so I don’t want to linger on this point too much, but it seems odd that in the era of shifting we don’t discuss day-to-day adjustments very much.
And that’s all that I’m talking about with this. Defense- and park-adjusted statistics are incredibly valuable tools, but they don’t get you all the way there, and that’s an important thing to keep in mind when you start doing nuanced analyses.
A few people kicked around some suggestions about my last piece on Tom Tango’s blog, so I’m following up with a couple more pieces of analysis that will hopefully shed some light on things. As a quick refresher, I looked at steal attempts with runners on the corners and found that the success rate is much larger than the break even point, especially with two outs. My research suggests teams are too conservative, i.e. they should send the runners more. For more about methods and data, look at the prior piece.
One initial correction from Tango is that I was treating one class of events improperly; that’s since been corrected. (Specifically, two out events where one runner is out and the other scores are now counted as successes, not failures.) Another point made by Peter Jensen is that I should consider what happens when the runners are moving and contact is made; that’s going to require a bit more grinding with the data, but it’s now on my list of things to look at.
Next, there were some questions about how much of the success rate is due to having abnormally good or bad runners. Here are two plots showing all successes and failures by the stolen base percentages of the runners on first and third. The first is for all situations, the second for two out situations only.
Quick data note: to compute attempts and stolen base percentage, I used a centered three-year average, meaning that if an attempt took place in 2010 the SB% fed in would be the aggregate figure from 2009–2011. These charts only include situations where both runners have at least 20 attempts.

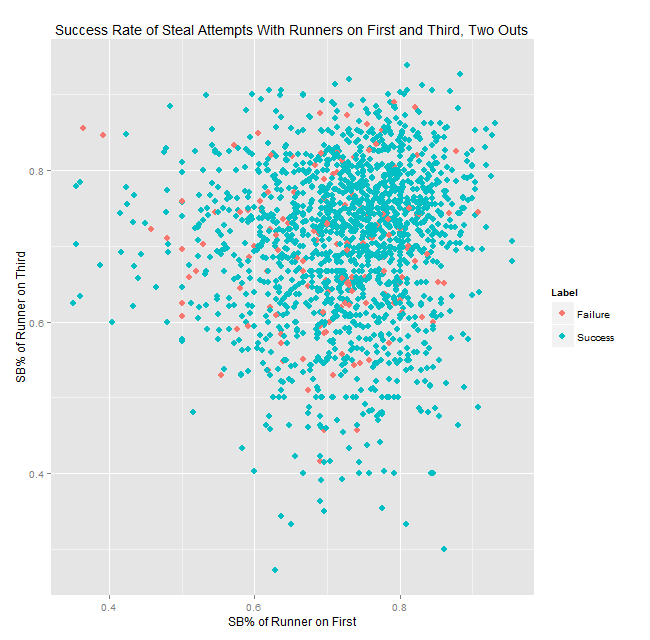
To simplify the charts a bit, I put the attempts into one of 36 buckets based on the SB% of the runners and then computed the success rates for those buckets; you can see the results in the tables below. The bucket boundaries are based on the distribution of SB%, so the 17th, 33rd, 50th, 67th, and 83rd percentiles. Sample sizes are roughly 55 for two outs (minimum 40) and 100-110 overall (minimum 73).
| Third Base SB% Bucket | ||||||
|---|---|---|---|---|---|---|
| 1st Base SB% Bucket | 27.3%—61.4% | 61.4%—68% | 68%—72.5% | 72.5%—75.8% | 75.8%—80% | 80%—95.5% |
| 33.3%—64.9% | 72.6 | 79.1 | 83.0 | 77.1 | 83.3 | 81.0 |
| 64.9%—70.6% | 80.3 | 85.6 | 80.8 | 88.2 | 86.8 | 87.1 |
| 70.6%—74.4% | 86.4 | 84.0 | 83.7 | 87.3 | 85.3 | 86.3 |
| 74.4%—77.6% | 85.6 | 85.9 | 91.4 | 86.4 | 92.7 | 89.8 |
| 77.6%—81.2% | 91.3 | 90.5 | 83.3 | 90.3 | 95.2 | 90.6 |
| 81.2%—96.2% | 90.8 | 84.9 | 89.4 | 90.8 | 93.6 | 89.1 |
| Third Base SB% Bucket | ||||||
|---|---|---|---|---|---|---|
| 1st Base SB% Bucket | 27.3%—60.9% | 60.9%—67.6% | 67.6%—72.1% | 72.1%—75.5% | 75.5%—80% | 80%—93.9% |
| 35%—64.1% | 86.9 | 89.2 | 87.7 | 84.6 | 92.5 | 89.4 |
| 64.1%—70.1% | 89.6 | 93.2 | 89.1 | 89.1 | 87.8 | 91.5 |
| 70.1%—74% | 92.7 | 85.7 | 91.7 | 96.6 | 93.3 | 91.5 |
| 74%—77.5% | 94.1 | 93.3 | 92.9 | 94.6 | 100.0 | 93.5 |
| 77.5%—81.1% | 95.0 | 87.7 | 94.4 | 93.5 | 98.2 | 97.1 |
| 81.1%—95.5% | 95.8 | 89.3 | 90.7 | 91.2 | 95.7 | 95.5 |
As you can see, even with noticeably below-average runners at both bases (average SB% is 70%), teams are successful so often that they should be trying it more often—all buckets but one in the two tables have a success rate above break-even. (BE rates are 75.5% overall and 69% for 2 outs.) There’s still a little bit of selection bias, which is pertinent, though I don’t think it accounts for most of the effect—see the note below. However, the fact that every single bucket comes in well above the break-even rate suggests to me that even accounting for the selection bias, this is still an area where managers should be more aggressive. At the very least, it seems that if there are two average base thieves on and two out, the runner on first should be going much more frequently than the current sub-10% attempt rate.
Note: One important thing to consider is that putting the attempts minimum in place noticeably increases the success rate—from 83% to 86% overall, and from 90% to 92% for two out situations. (The explanation for that is that really slow players don’t necessarily have poor SB%, they just have next to no stolen base attempts, so they are falling out of the data.) However, if you stick to the attempts where one or both runners have few attempts, the success rate only drops about 2 percentage points, which is still pretty far above the breakeven point overall and with two outs.
(Note: Inspired by this post from Jeff Fogle, I decided to change the format up a bit for this post, specifically by putting an abstract at the beginning. We’ll see if it sticks.) This post looks at baserunning strategy with runners on first and third, specifically having to do with when to have the runner on first attempt to steal. My research suggests that teams may be currently employing this strategy in a non-optimal manner. While they start the runner as often as they should with one out, they should probably run more frequently with zero and two outs with runners on first and third than they currently. The gain from this aggressiveness is likely to be small, on the order of a few runs a season. Read on if you want to know how I came to this conclusion.
Back when I used to play a lot of the Triple Play series, I loved calling for a steal with runners on first and third. It seemed like you could basically always get the runner to second, and if he drew a throw then the runner on third would score. It’s one of those fun plays that introduced a bit of chaos and works disproportionately frequently in videogames. Is that last statement true? Well, I don’t know how frequently it worked in Triple Play 99, but I can look at how frequently it works in the majors. And it appears to work pretty darn frequently.*
* I haven’t found any prior research directly addressing this, but this old post by current Pirates analytics honcho Dan Fox obliquely touches on it. I’m pretty confident that his conclusions are different because he’s omitting an important case and focusing directly on double steals, and not because either one of us is wrong.
The data I looked at were Retrosheet play-by-play data from 1989–2013, looking at events classified as caught stealing, stolen bases, balks, and pickoffs with runners at first and third. I then removed caught stealing and steals where the runner on first remained on first at the end of the play, leaving 8500 events or so. That selection of events is similar to what Tom Tango et al. do in The Book and control for the secondary effects of base stealing, but I added the restriction about the runner on first to remove failed squeezes, straight steals of home, and other things that aren’t related to what we’re looking at. This isn’t going to perfectly capture the events we want, but modulo the limitations of play-by-play data it’s the best cut of the data I could think of. (It’s missing two big things: the impact of running on batter performance and what happens when the runners go and the ball is put in play. The first would take a lot of digging to guess at, and the second is impossible to get from my data, so I’m going to postulate they have a small effect and leave it at that.)
So, let’s say we define an outcome to be successful if it leads to an increased run expectancy. (Run expectancy is computed empirically and is essentially the average number of runs scored in the remainder of an inning given where the baserunners are and how many outs there are.) In this particular scenario, increased run expectancy is equivalent to an outcome where both runners are safe, which occurs 82.7% of the time. For reference, league average stolen base percentage over this period is 69.9% (via the Lahman database), so that’s a sizeable difference in success rates (though the latter figure doesn’t account for pickoffs, errors, and balks). (For what it’s worth, both of those numbers have gone up between 4 and 6 percentage points in the last five years.)
How much of that is due to self-selection and how much is intrinsic to the situation itself? In other words, is this just a function of teams picking their spots? It’s hard to check every aspect of this (catcher, pitcher, leverage, etc.), so I chose to focus on one, which is the stolen base percentage of the runner on first. I used a three year centered average for the players (meaning if the attempt took place in 1999, I used their combined stolen base figures from 1998–2000), and it turns out that on aggregate runners on first during 1st and 3rd steal attempts are about one percentage point better than the league average. That’s noticeable and not meaningless, but given how large the gap in success rate is the increased runner quality can’t explain the whole thing.
Now, what if we want to look at the outcomes more granularly? The results are in the table below. (The zeros are actually zero, not rounded.)
| Runner on First’s Destination | |||||
|---|---|---|---|---|---|
| Runner on Third’s Destination | Out | 1st Base | 2nd Base | 3rd Base | Run |
| Out | 0.20 | 0.97 | 2.78 | 0.23 | 0.00 |
| 3rd Base | 12.06 | 0.00 | 69.89 | 0.00 | 0.00 |
| Run | 1.07 | 0.36 | 9.31 | 2.98 | 0.15 |
This doesn’t directly address run expectancy, which is what we need if we’re going to actually determine the utility of this tactic. If you take into account the number of outs, balks, and pickoffs and combine the historical probabilities seen in that table with Baseball Prospectus’s 2013 run expectancy tables*, you get that each attempt is worth about 0.07 runs. (Restricting to the last five years, it’s 0.09.) That’s something, but it’s not much—you’d need to have 144 attempts a year at that success rate to get an extra win, which isn’t likely to happen given that there only about 200 1st and 3rd situations per team per year according to my quick count. Overall, the data suggest the break even success rate is on the order of 76%.**
* I used 2013 tables a) to simplify things and b) to make these historical rates more directly applicable to the current run environment.
** That’s computed using a slight simplification—I averaged the run values of all successful and unsuccessful outcomes separately, then calculated the break even point for that constructed binary process. Take the exact values with a grain of salt given the noise in the low-probability, high-impact outcomes (e.g. both runners score, both runners are out).
There’s a wrinkle to this, though, which is that the stakes and decision making processes are going to be different with zero, one, or two outs. In the past, the expected value of running with first and third is actually negative with one out (-0.04), whereas the EV for running with two outs is about twice the overall figure. (The one out EV is almost exactly 0 over the last five years, but I don’t want to draw too many conclusions from that if it’s a blip and not a structural change.) That’s a big difference, probably driven by the fact that the penalty for taking the out is substantially less with two outs, and it’s not due to a small sample—two out attempts make up more than half the data. (For what it’s worth, there aren’t substantive discrepancies in the SB% of the runners involved between the different out states.) The table below breaks it down more clearly:
| Number of Outs | Historical Success Percentage | Break Even Percentage |
|---|---|---|
| 0 | 81.64 | 74.61 |
| 1 | 73.65 | 78.00 |
| 2 | 88.71 | 69.03 |
| Overall | 82.69 | 75.52 |
That third row is where I think there’s a lot of hay to be made, and I think the table makes a pretty clear case: managers should be quite aggressive about starting the runner if there’s a first and third with two outs, even if there’s a slightly below average runner at first. They should probably be a bit more aggressive than they currently are with no outs, and more conservative with one out.
There’s also plenty of room for this to happen more frequently; with two outs, the steal attempt rate last year was about 6.6% (it’s 5% with one out, and 4% with no outs). The number of possible attempts per team last year was roughly 200, split 100/70/30 between 2/1/0 outs, so there are some reasonable gains to be made. It’s not going to make a gigantic impact, but if a team sends the runner twice as often as they have been with two outs (about one extra time per 25 games), that’s a run gained, which is small but still an edge worth taking. Maybe my impulses when playing Triple Play had something to them after all.
